> ## Documentation Index
> Fetch the complete documentation index at: https://docs.abconvert.io/llms.txt
> Use this file to discover all available pages before exploring further.
# Statistical Significance in A/B Testing Explained
> Learn how to read statistical significance in Analytics v2, including p-values, confidence intervals, and Bayesian win probabilities.
This page helps you answer one practical question: "How strong is the evidence for this result?"
Before you read the statistics, choose the metric that best matches the Test goal. See [How to interpret Analytics results](/analytics/interpret-results) for the full decision workflow.
Analytics v2 gives you two statistical views of the same Test:
* **Frequentist analysis** for clear pass/fail decision support.
* **Bayesian analysis** for early directional guidance when traffic is still low.
Use both together when you review the selected metric.
## Key facts
* A p-value shows the strength of evidence that the observed difference is unlikely to be random noise.
* A confidence interval shows uncertainty around the estimated impact.
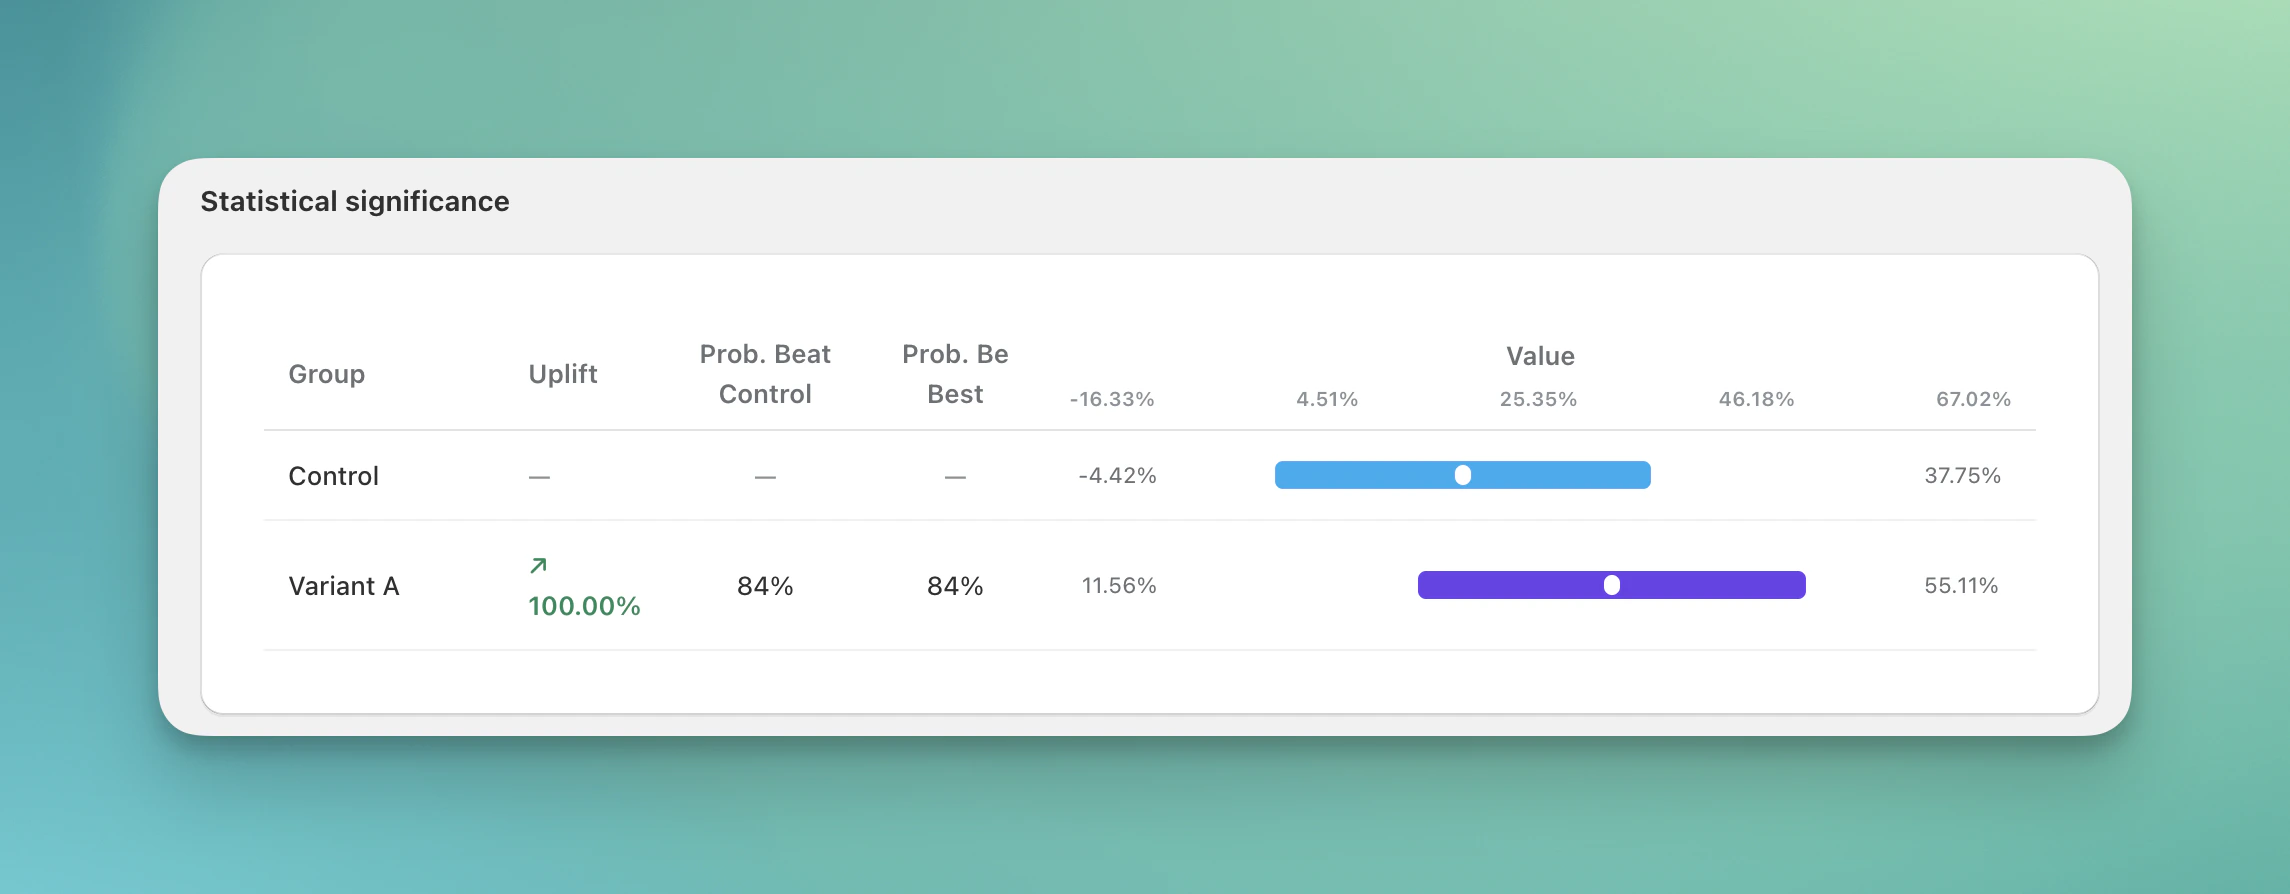
* Prob. Beat Control and Prob. Be Best estimate how likely a variant is to beat control or be best for the selected metric.
* More visitors, conversions or orders, and run time make results more stable.
## Frequentist analysis: clear decision support
Frequentist analysis is useful when you need structured evidence for go or no-go decisions.
In Analytics v2, this view is represented mainly by **p-value** and **confidence interval**.
### How to read p-value
A p-value describes how surprising the observed result would be if there were no real difference between variants.
Lower p-values are stronger evidence that the observed difference is unlikely to be random noise under the test assumptions.
| P-value | What it means |
| ----------- | -------------------------------------------------------------------------------------------- |
| > 0.10 | Weak evidence. Usually too early or no clear difference. |
| 0.05 - 0.10 | Borderline. Keep running the Test. |
| \< 0.05 | Statistically significant. Strong evidence against no difference under the test assumptions. |
| \< 0.01 | Very strong evidence. |
A p-value below 0.05 does not mean there is a 95% chance your variant is
better. It means the observed gap is unlikely to be random noise.
### How to read confidence intervals
Confidence intervals show a likely range for the true impact, based on the data and method.
A narrow range means a more stable estimate. A wide range means more uncertainty. A range that includes both good and bad outcomes means the result is still mixed.
For example, if Revenue per Visitor is 2.40 and the interval is \[1.10, 3.70], the true value could reasonably fall anywhere in that range.
 ## Bayesian analysis: early directional guidance
Bayesian analysis is useful when you do not have enough traffic for a strong frequentist result yet.
It helps you understand which variant is leading right now and how stable that lead looks.
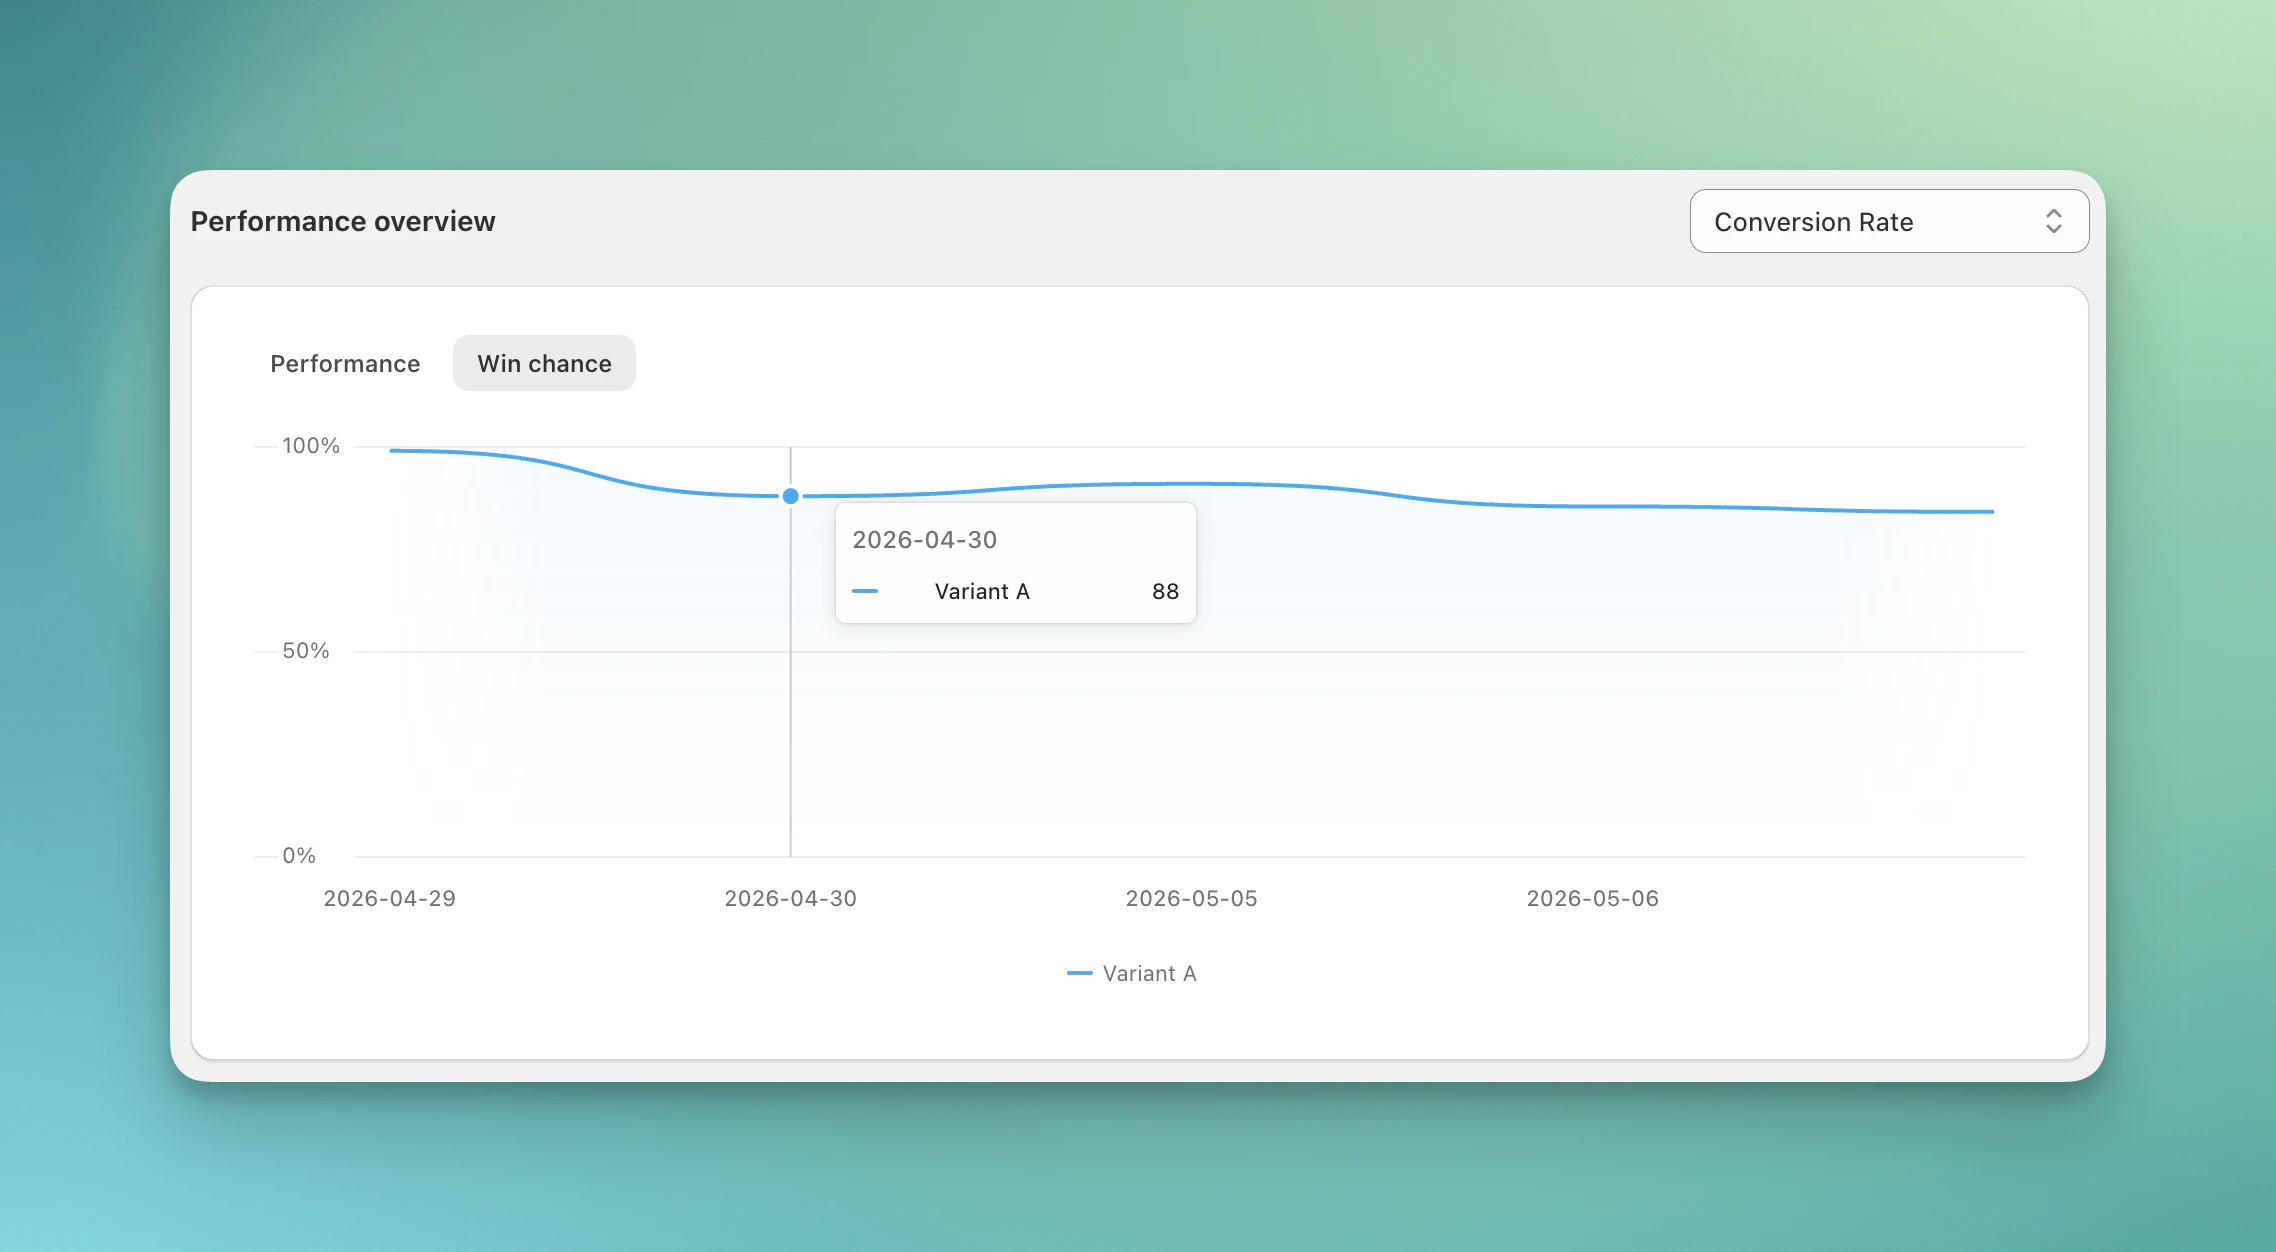
* **Prob. Beat Control**: the model-estimated chance that a variant is better than control for the selected metric.
* **Prob. Be Best**: the model-estimated chance that a variant is best among all variants in the Test.
These probabilities can change as more data arrives. Read them for the selected metric and model shown in the dashboard.
## Bayesian analysis: early directional guidance
Bayesian analysis is useful when you do not have enough traffic for a strong frequentist result yet.
It helps you understand which variant is leading right now and how stable that lead looks.
* **Prob. Beat Control**: the model-estimated chance that a variant is better than control for the selected metric.
* **Prob. Be Best**: the model-estimated chance that a variant is best among all variants in the Test.
These probabilities can change as more data arrives. Read them for the selected metric and model shown in the dashboard.
 Do not decide based on one snapshot. Look for a consistent pattern across
multiple refreshes.
## How to use frequentist and Bayesian results together
ABConvert shows both statistical systems. Read them in this order:
Check **Prob. Beat Control** and **Prob. Be Best**. If they are unstable or
keep flipping, keep running the Test.
Before final rollout, verify that p-value is below 0.05 and confidence
intervals are not too wide.
Make sure uplift is meaningful for your store, not just statistically
detectable.
Launch the winning variant when Bayesian trend and frequentist evidence both
support the same direction.
Run your Test for at least one full business cycle before making a final
decision. For most stores, that means around 1-2 weeks so weekday and weekend
behavior are both included. You still need enough visitors, conversions or
orders, and balanced traffic.
## What to do when results are inconclusive
Sometimes the result is still unclear after several days. That is normal.
If the statistical result is still mixed, do this:
* Keep the current winner (usually control) while you collect more data.
* Extend the run window and review again after more traffic arrives.
* Check segments such as country, device type, or visitor type to find hidden differences.
* If signals stay flat, treat it as "no meaningful difference" and test a bigger idea next.
Inconclusive results are still useful. They tell you your current variant is not strong enough to justify a rollout yet.
Do not decide based on one snapshot. Look for a consistent pattern across
multiple refreshes.
## How to use frequentist and Bayesian results together
ABConvert shows both statistical systems. Read them in this order:
Check **Prob. Beat Control** and **Prob. Be Best**. If they are unstable or
keep flipping, keep running the Test.
Before final rollout, verify that p-value is below 0.05 and confidence
intervals are not too wide.
Make sure uplift is meaningful for your store, not just statistically
detectable.
Launch the winning variant when Bayesian trend and frequentist evidence both
support the same direction.
Run your Test for at least one full business cycle before making a final
decision. For most stores, that means around 1-2 weeks so weekday and weekend
behavior are both included. You still need enough visitors, conversions or
orders, and balanced traffic.
## What to do when results are inconclusive
Sometimes the result is still unclear after several days. That is normal.
If the statistical result is still mixed, do this:
* Keep the current winner (usually control) while you collect more data.
* Extend the run window and review again after more traffic arrives.
* Check segments such as country, device type, or visitor type to find hidden differences.
* If signals stay flat, treat it as "no meaningful difference" and test a bigger idea next.
Inconclusive results are still useful. They tell you your current variant is not strong enough to justify a rollout yet.