> ## Documentation Index
> Fetch the complete documentation index at: https://docs.abconvert.io/llms.txt
> Use this file to discover all available pages before exploring further.
# Analytics Overview: Understanding Your A/B Test Results
> Learn how ABConvert tracks your store's conversion funnel and how to use the analytics dashboard to interpret experiment results.
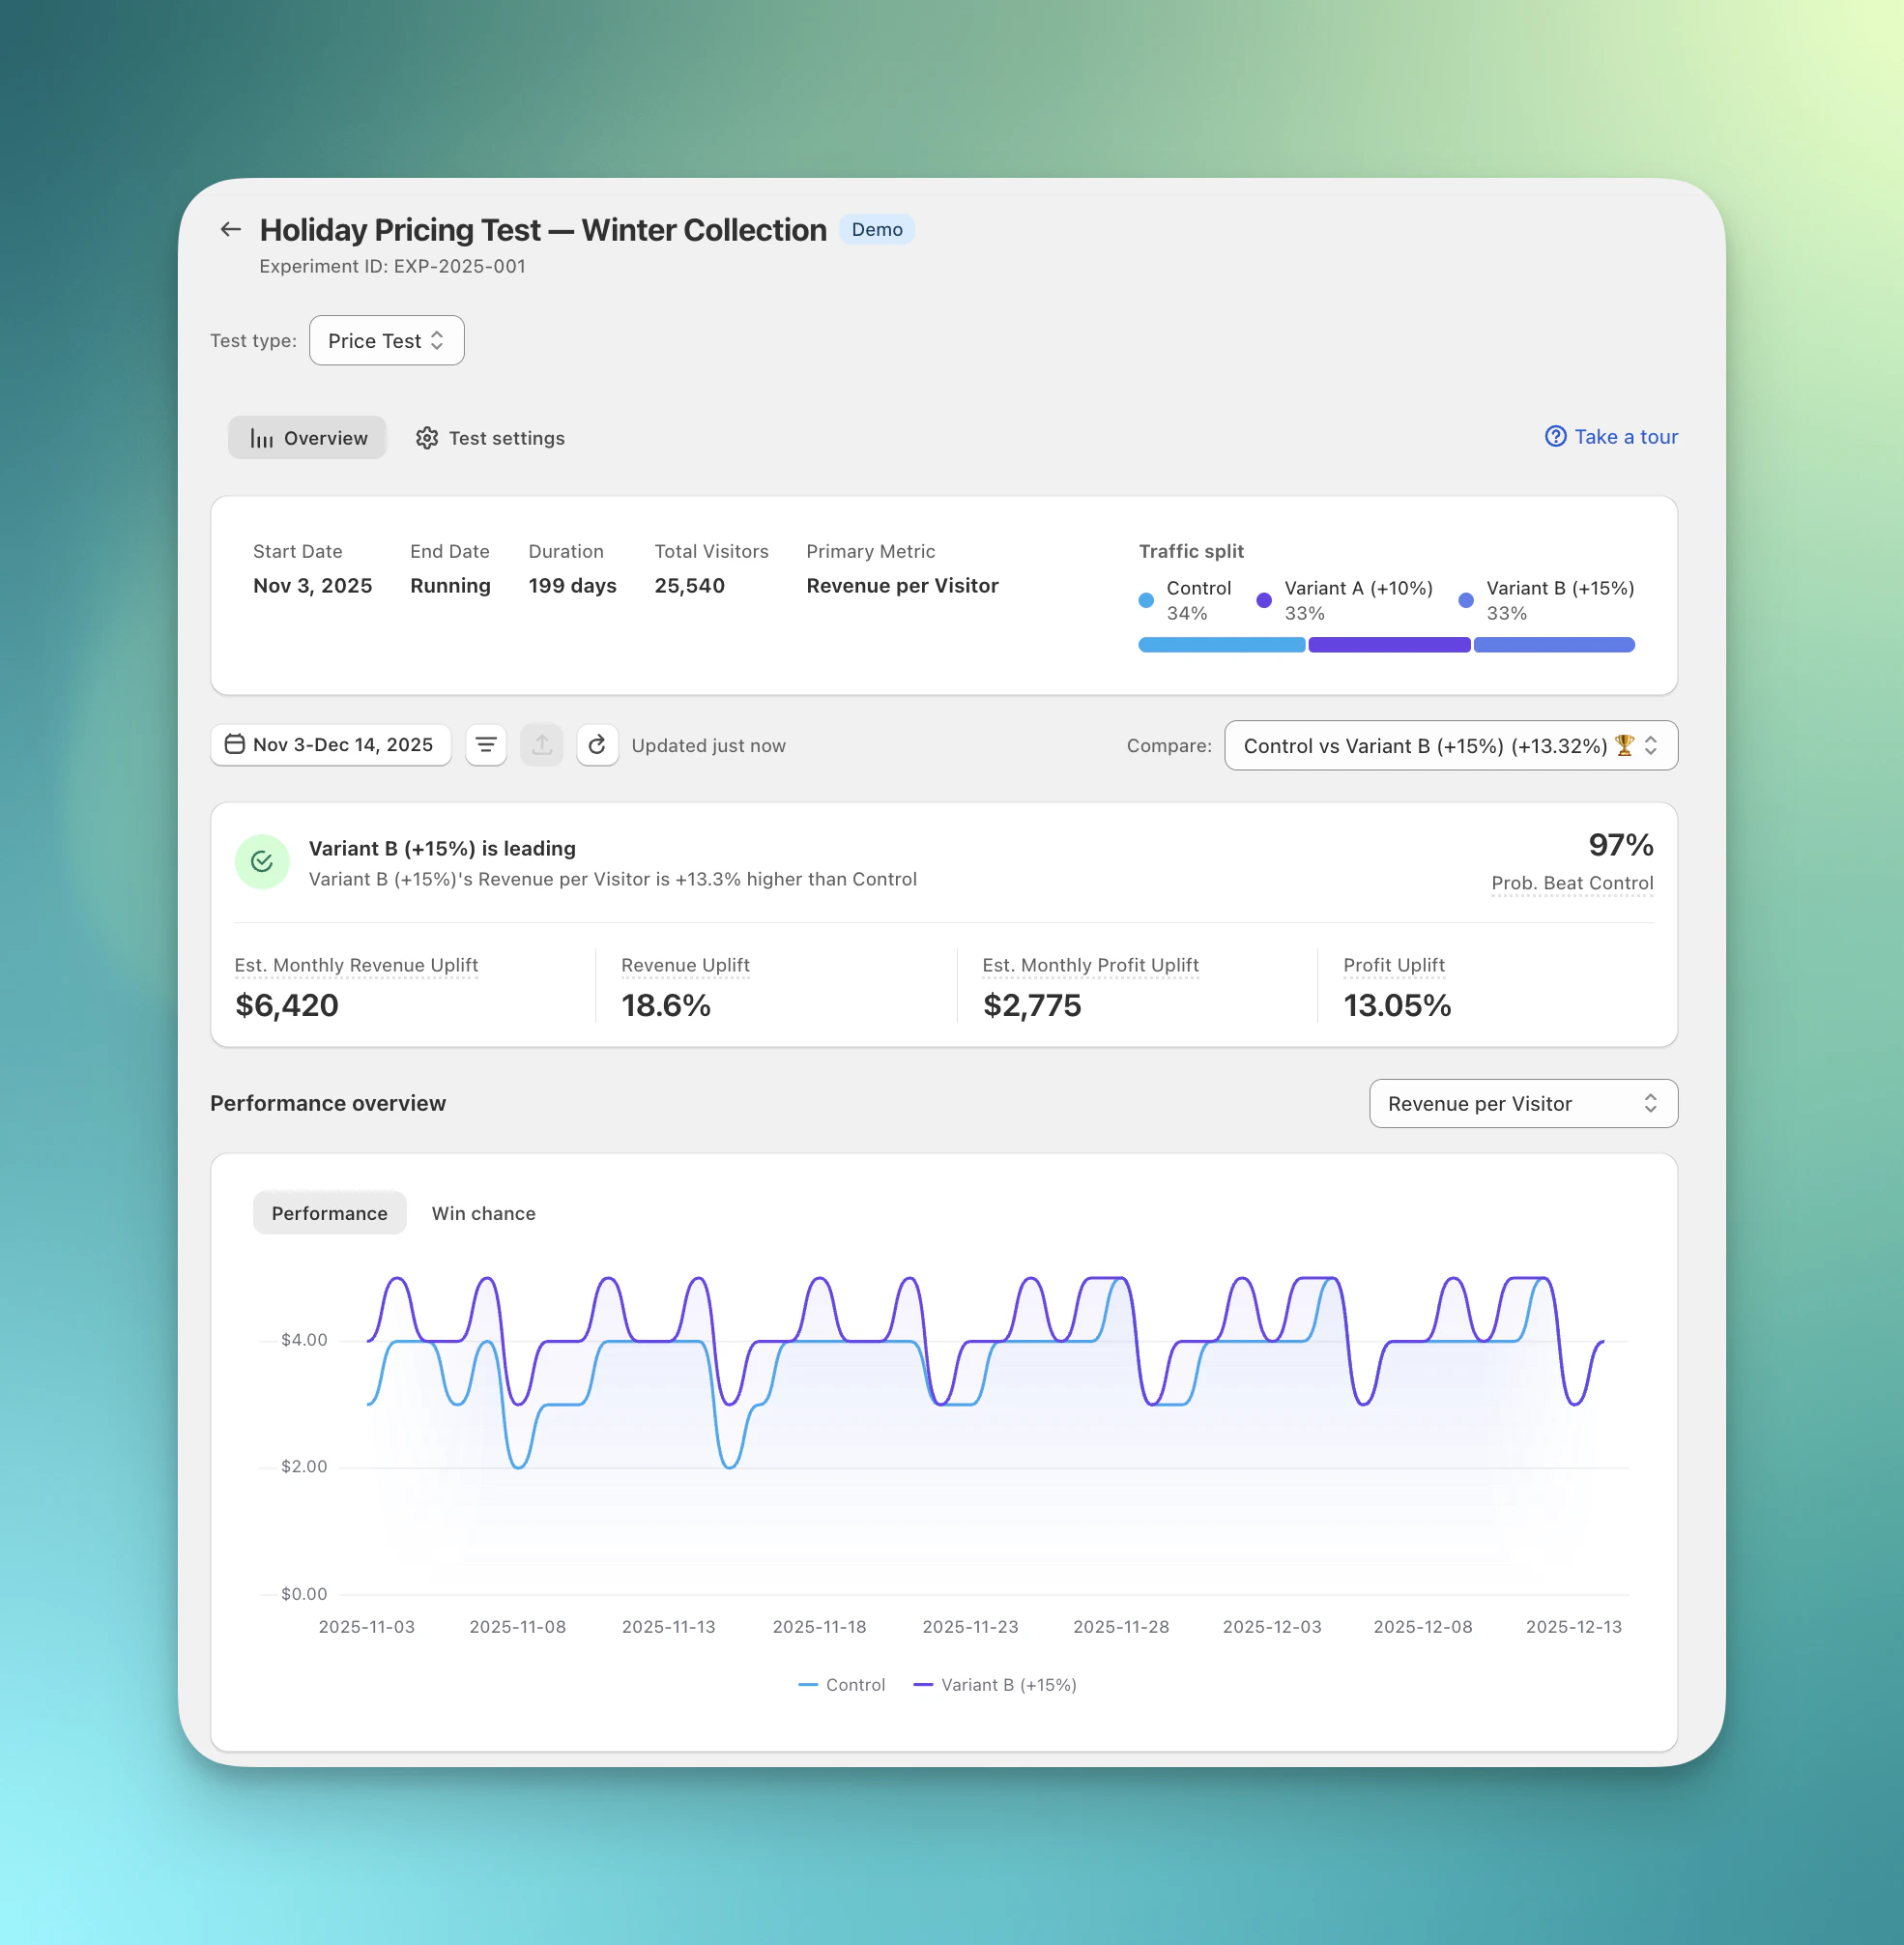
The analytics dashboard is where you see whether your experiments are working. Every time a visitor loads a page, adds something to their cart, reaches checkout, or completes checkout, ABConvert records that event and attributes it to the correct test group. You can review these results at any time as snapshots refresh throughout the day.
## Accessing your analytics
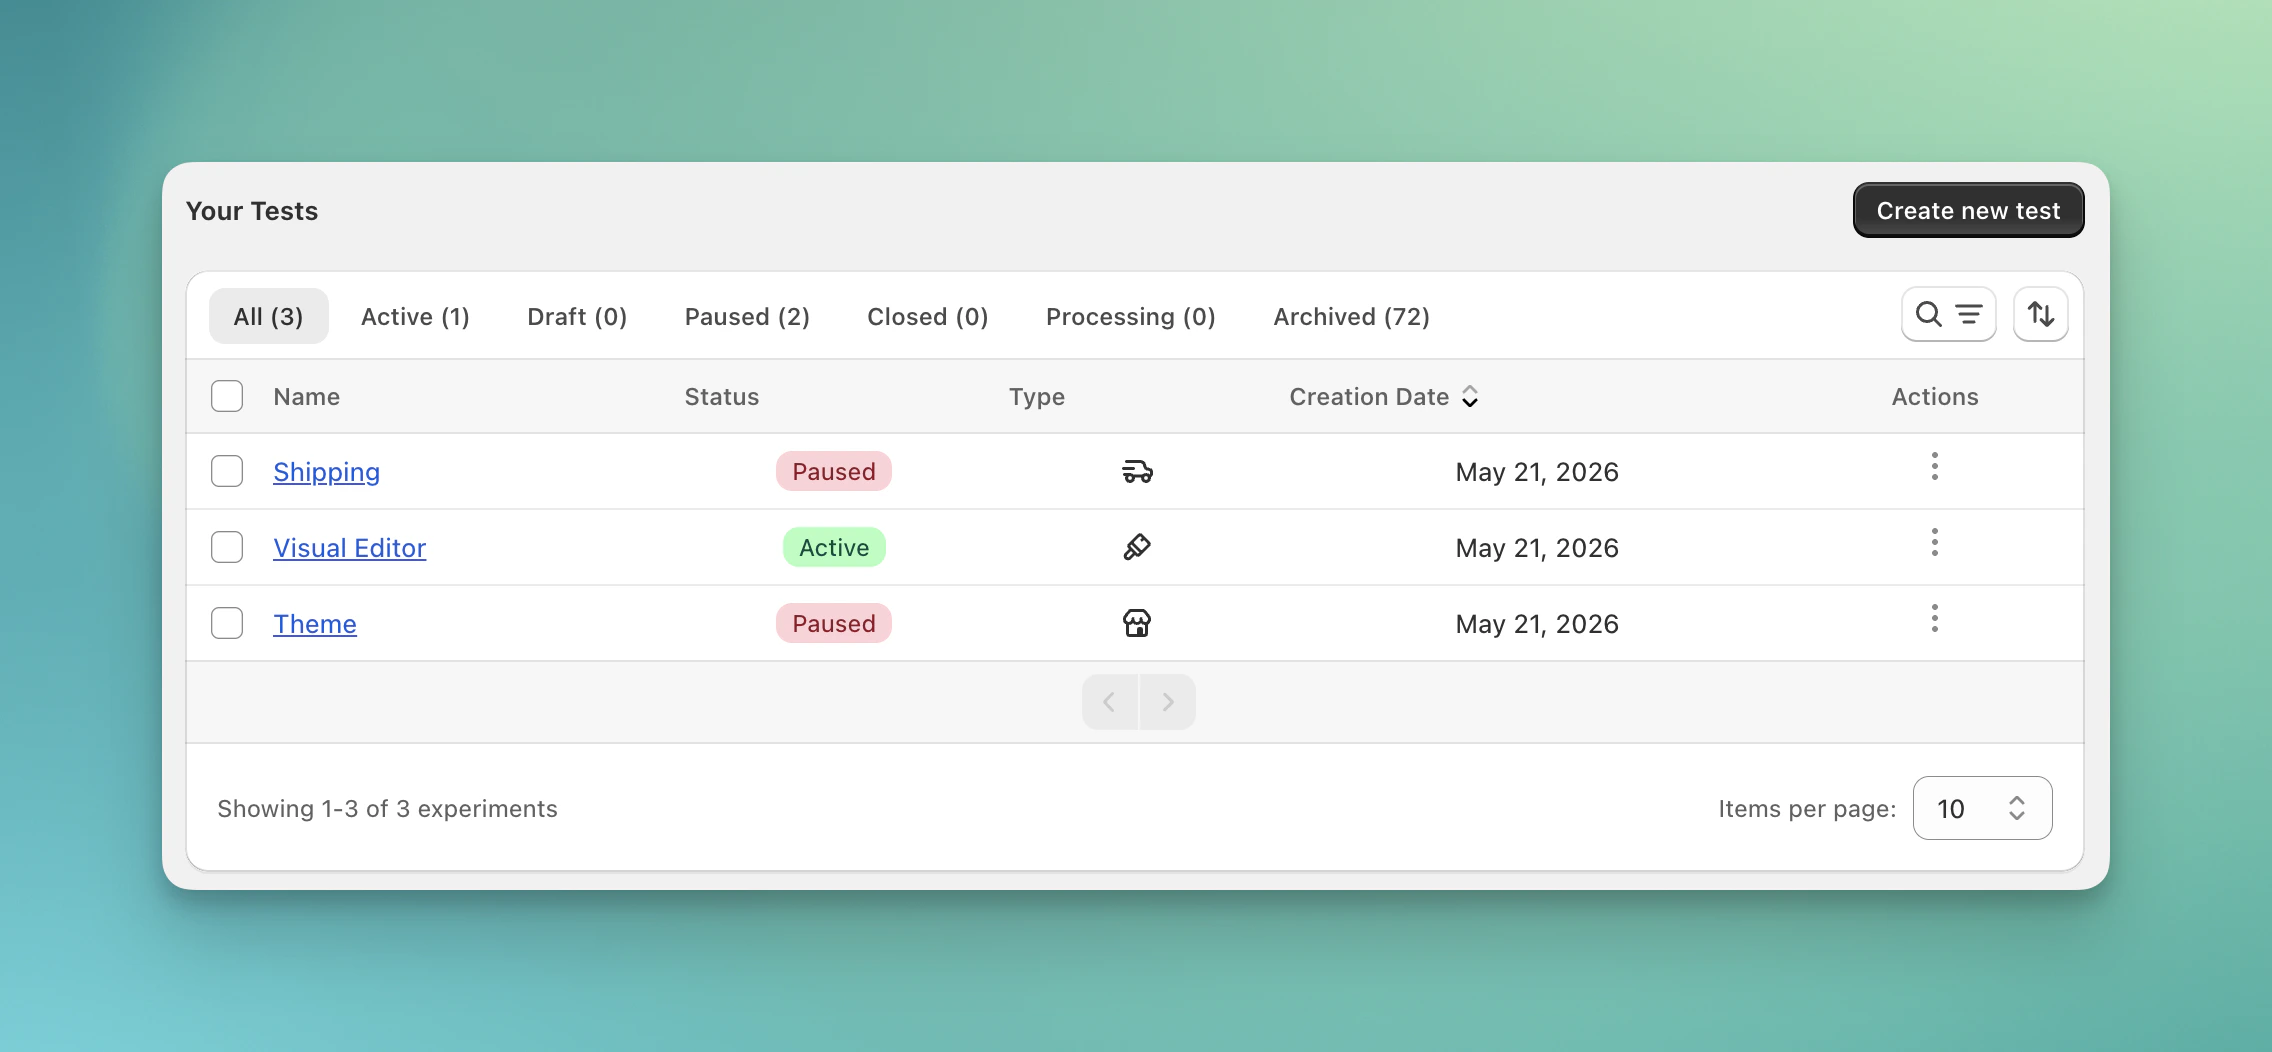
To view analytics for an experiment, go to the experiment table on your ABConvert homepage and open the analytics page for that experiment. From there you can see a breakdown of results for each test group, filter the data by date range or visitor segment, and track statistical confidence over time.
 To turn this dashboard into a decision, see [How to interpret Analytics results](/analytics/interpret-results).
## What does the conversion funnel track?
ABConvert tracks the purchase journey for every experiment. By default, most experiments show a standard 4-step funnel:
A distinct session in your experiment. Sessions is always the top of the funnel and serves as the 100% baseline for all conversion rate calculations.
The visitor adds the product to their cart. This is the first indicator of purchase intent.
The visitor reaches the checkout page. This shows they moved past browsing and are actively considering buying.
The visitor completes a purchase. This is the final conversion event and triggers all revenue metrics.
Every stage is tracked per test group, so you can compare how each variant performs at each point in the funnel — not just at the order level.
### Custom funnel steps
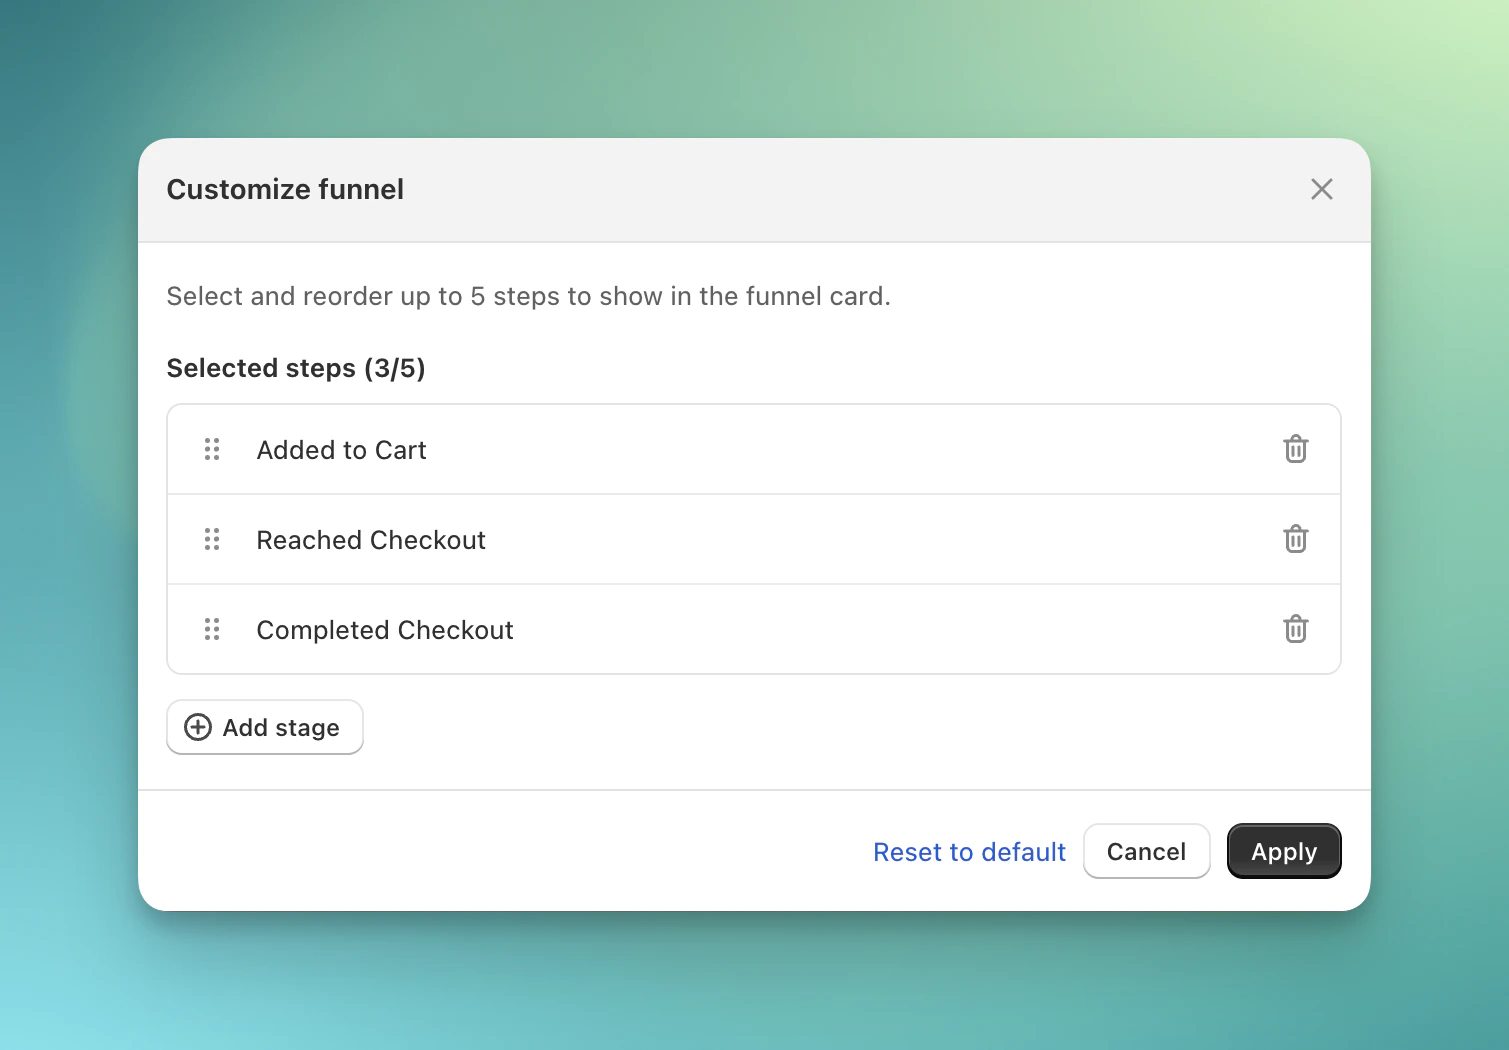
In Analytics v2, you can customize the funnel stages to track more granular events like *Shipping Information Submitted* or *Payment Submitted*. This lets you identify exactly where visitors drop off in your specific flow.
With custom funnel steps, Sessions remains fixed as the baseline, and you can select up to **5 additional stages** from the available tracked events to display in the Conversion Funnel card.
To configure your funnel:
1. Navigate to the **Conversion Funnel** card on your analytics dashboard.
2. Click the **Customize** icon in the top right of the card.
3. Select up to **5 custom steps** from the available event types in addition to Sessions.
4. Click **Apply Changes**.
To turn this dashboard into a decision, see [How to interpret Analytics results](/analytics/interpret-results).
## What does the conversion funnel track?
ABConvert tracks the purchase journey for every experiment. By default, most experiments show a standard 4-step funnel:
A distinct session in your experiment. Sessions is always the top of the funnel and serves as the 100% baseline for all conversion rate calculations.
The visitor adds the product to their cart. This is the first indicator of purchase intent.
The visitor reaches the checkout page. This shows they moved past browsing and are actively considering buying.
The visitor completes a purchase. This is the final conversion event and triggers all revenue metrics.
Every stage is tracked per test group, so you can compare how each variant performs at each point in the funnel — not just at the order level.
### Custom funnel steps
In Analytics v2, you can customize the funnel stages to track more granular events like *Shipping Information Submitted* or *Payment Submitted*. This lets you identify exactly where visitors drop off in your specific flow.
With custom funnel steps, Sessions remains fixed as the baseline, and you can select up to **5 additional stages** from the available tracked events to display in the Conversion Funnel card.
To configure your funnel:
1. Navigate to the **Conversion Funnel** card on your analytics dashboard.
2. Click the **Customize** icon in the top right of the card.
3. Select up to **5 custom steps** from the available event types in addition to Sessions.
4. Click **Apply Changes**.
 **Session-based configuration:** Funnel customization is currently session-based. Your changes only affect your current browser view and reset to the default on page refresh. Other team members see the default funnel unless they customize it themselves.
## Which revenue and discount metrics can I review?
Analytics also includes revenue and discount metrics so you can evaluate business impact alongside conversion results.
* **Revenue and profit metrics** show order value, revenue per visitor, and profit per visitor. See [Revenue and profit metrics](/analytics/metrics-revenue-profit).
* **Discount metrics** show how much discount cost contributes to each variant's result. See [Discount metrics](/analytics/metrics-discount).
## What can I see in the breakdown table?
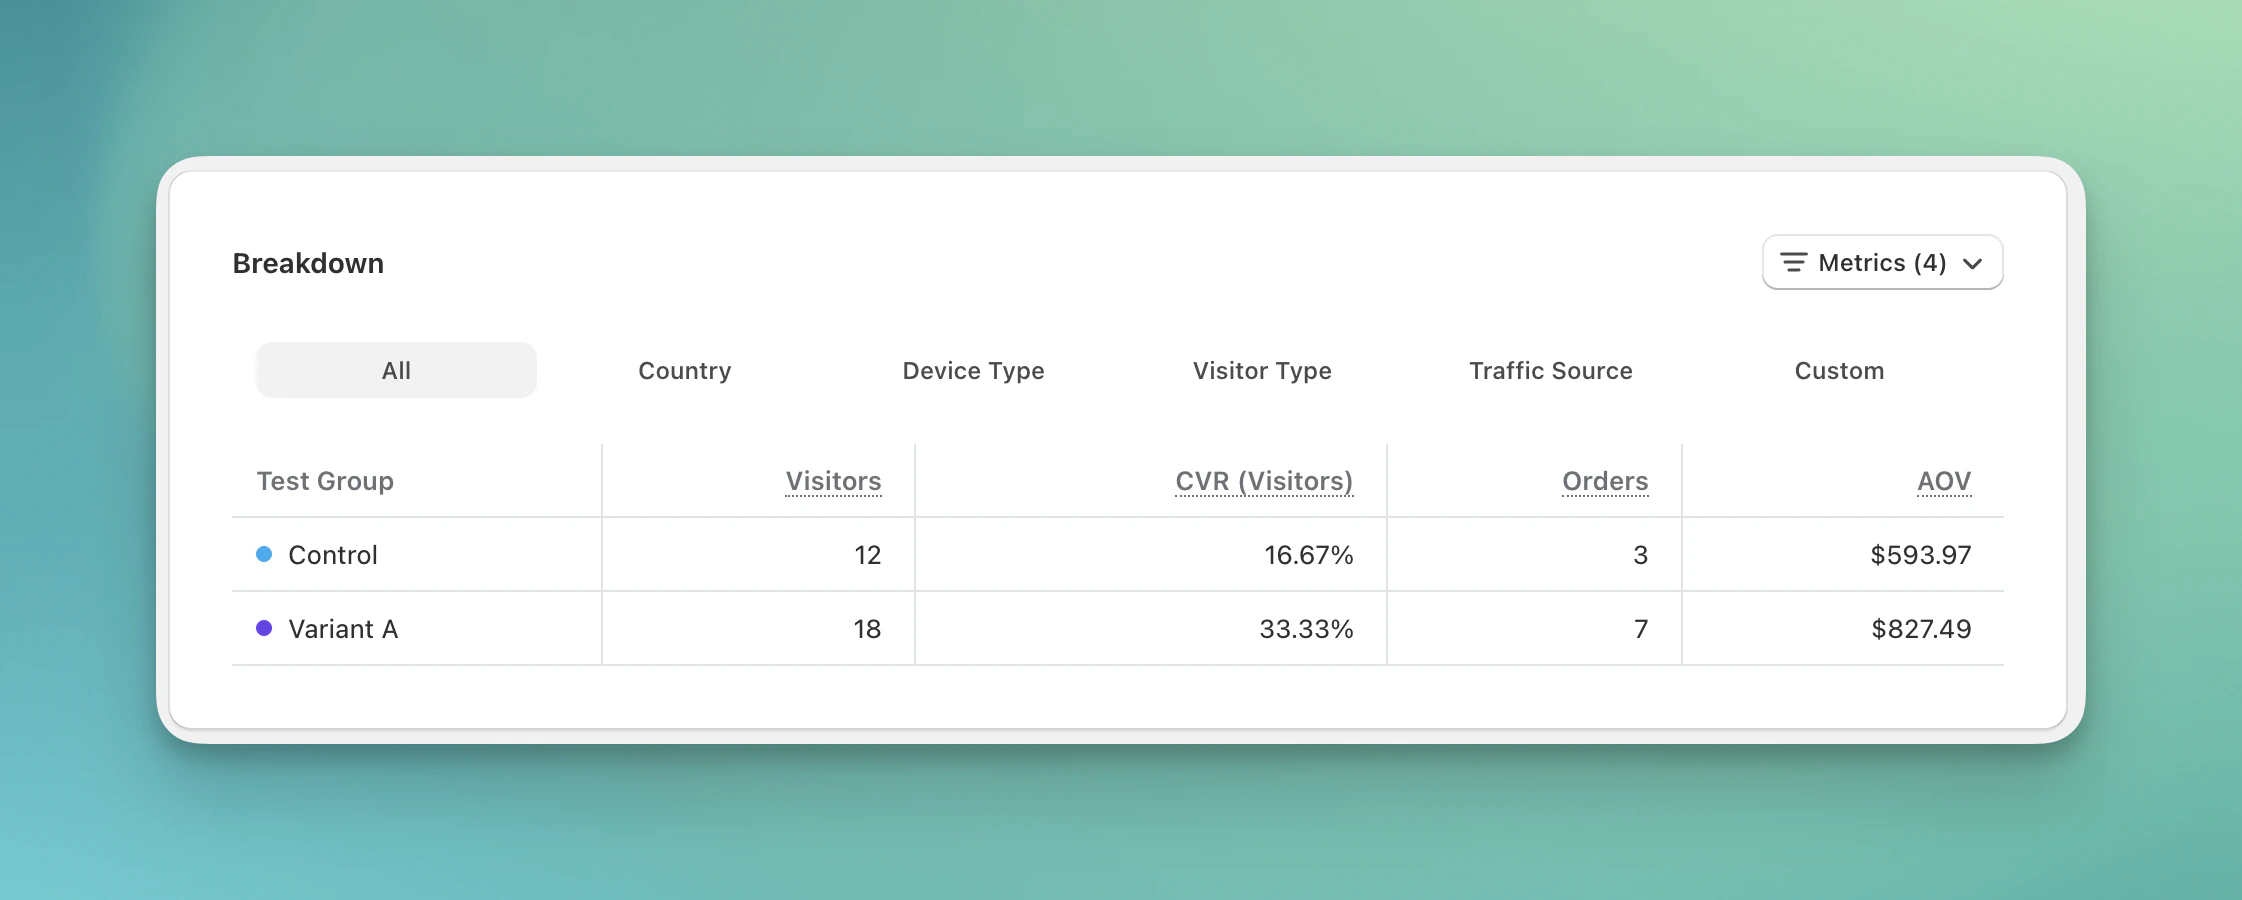
The **Breakdown** table lets you review the metrics you care about across test groups and dimensions. Use **Metrics** to choose which values to compare, such as visitors, conversion rate, orders, or average order value. Then select a dimension to see how variant performance changes across an audience or traffic segment.
### How do I add dimensions to the breakdown table?
Select **Country**, **Device Type**, **Visitor Type**, or **Traffic Source** to group the table results by one preset dimension.
**Session-based configuration:** Funnel customization is currently session-based. Your changes only affect your current browser view and reset to the default on page refresh. Other team members see the default funnel unless they customize it themselves.
## Which revenue and discount metrics can I review?
Analytics also includes revenue and discount metrics so you can evaluate business impact alongside conversion results.
* **Revenue and profit metrics** show order value, revenue per visitor, and profit per visitor. See [Revenue and profit metrics](/analytics/metrics-revenue-profit).
* **Discount metrics** show how much discount cost contributes to each variant's result. See [Discount metrics](/analytics/metrics-discount).
## What can I see in the breakdown table?
The **Breakdown** table lets you review the metrics you care about across test groups and dimensions. Use **Metrics** to choose which values to compare, such as visitors, conversion rate, orders, or average order value. Then select a dimension to see how variant performance changes across an audience or traffic segment.
### How do I add dimensions to the breakdown table?
Select **Country**, **Device Type**, **Visitor Type**, or **Traffic Source** to group the table results by one preset dimension.
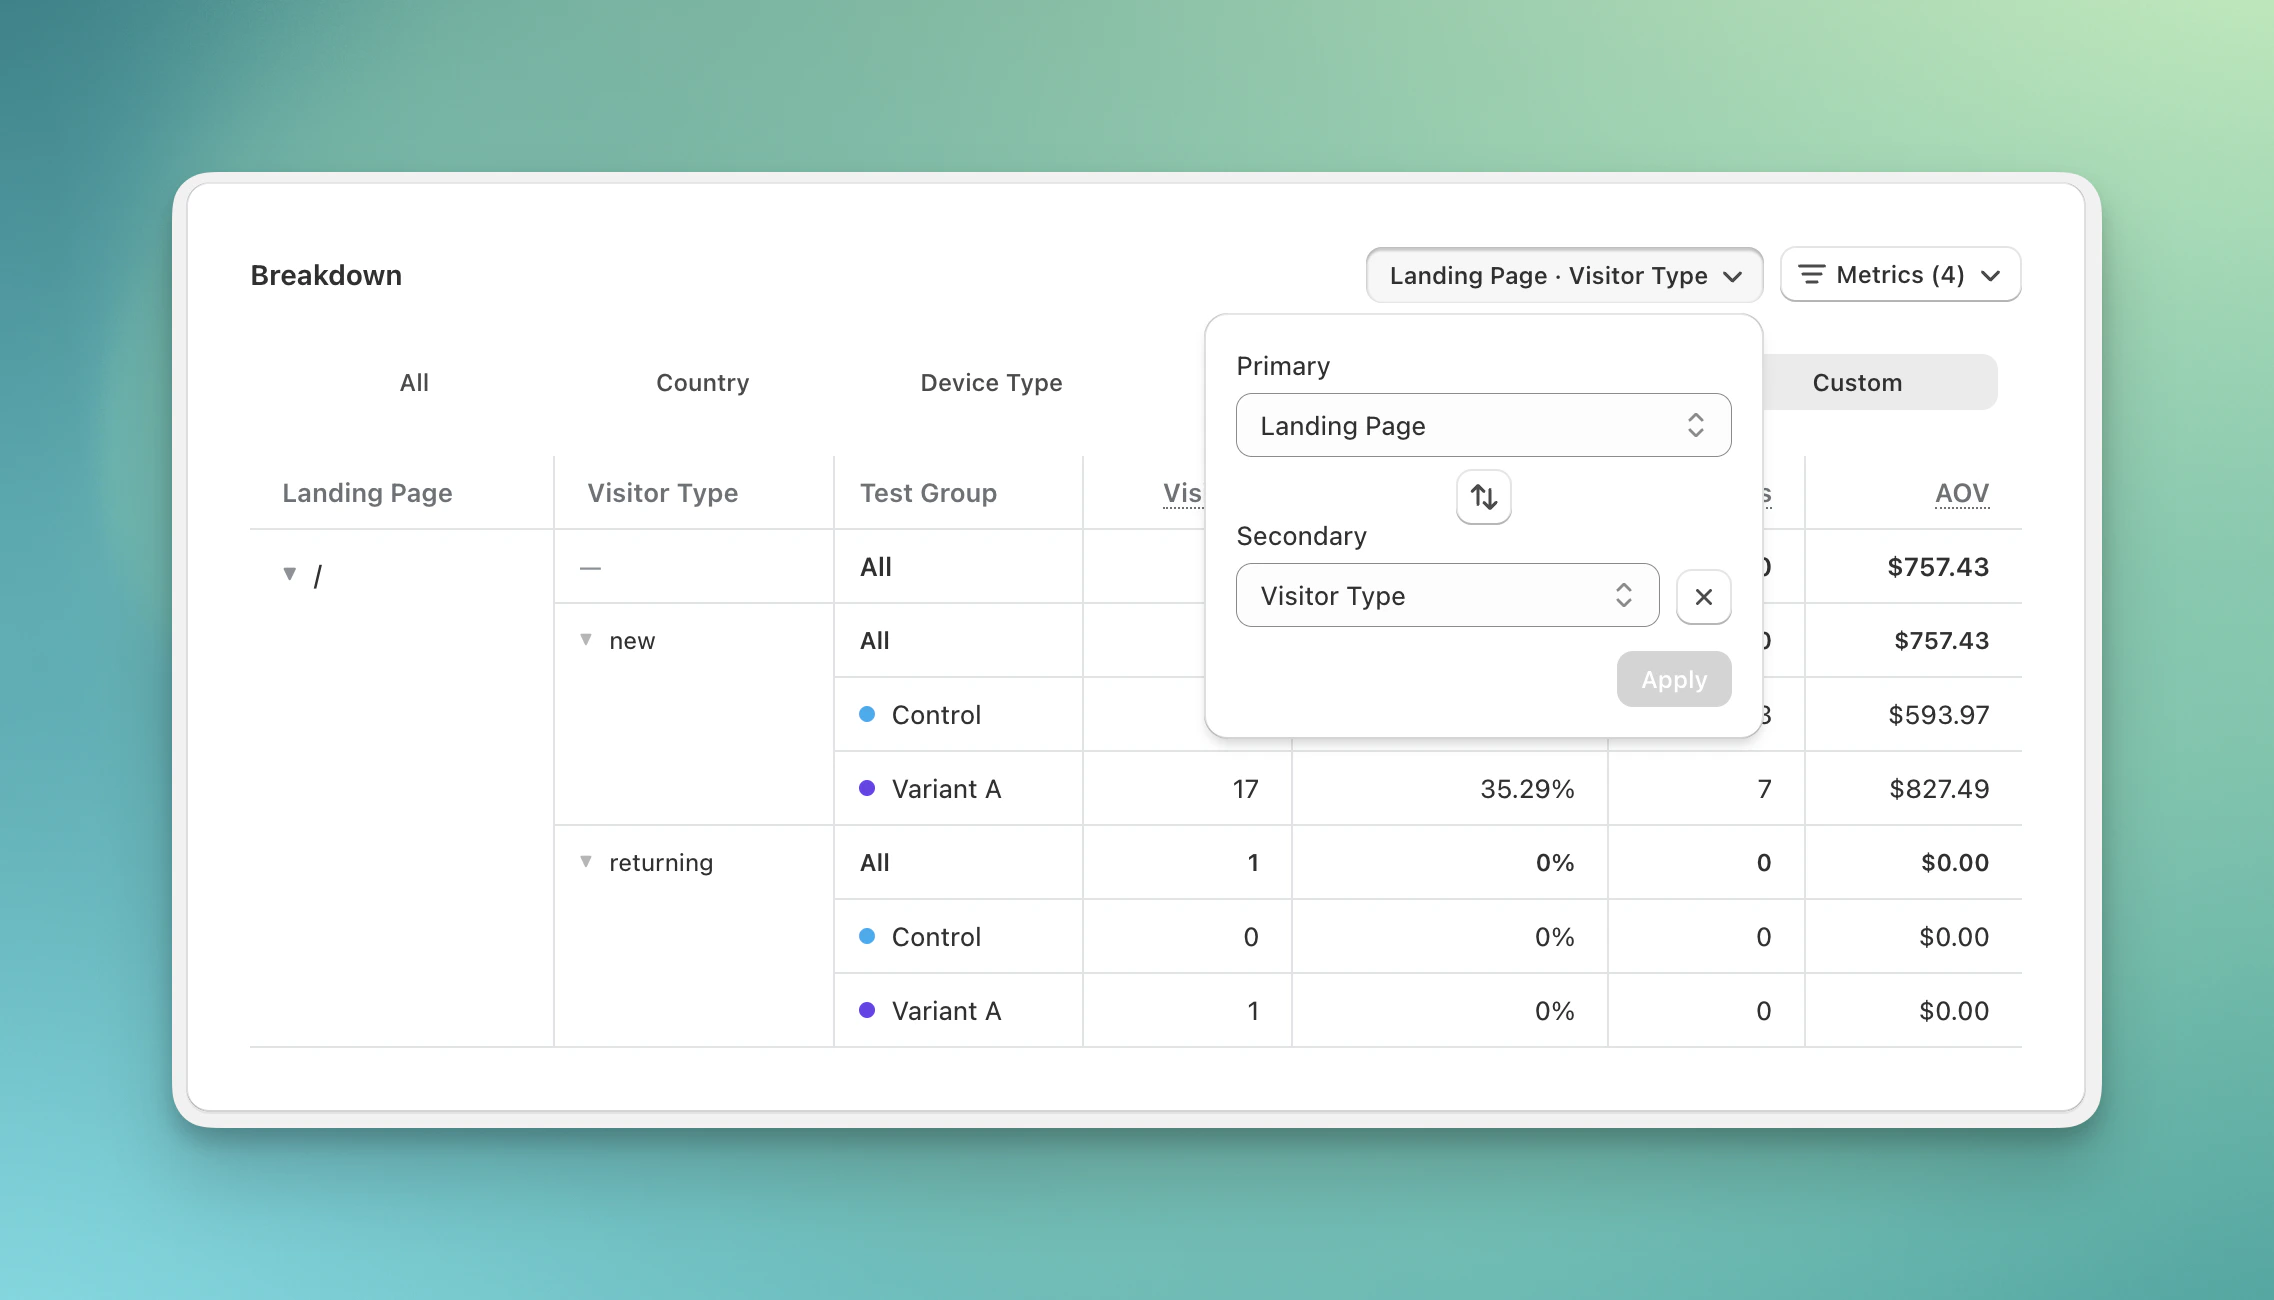
 To combine two dimensions in the same table:
Click **Custom** in the **Breakdown** table.
Select the first level used to group results, such as **Landing Page**.
Optionally select a nested level, such as **Visitor Type**, to compare segments within each primary group.
Click **Apply** to update the table. Use the swap button to reverse the primary and secondary order when needed.
To combine two dimensions in the same table:
Click **Custom** in the **Breakdown** table.
Select the first level used to group results, such as **Landing Page**.
Optionally select a nested level, such as **Visitor Type**, to compare segments within each primary group.
Click **Apply** to update the table. Use the swap button to reverse the primary and secondary order when needed.
 ## Filtering your results
You can narrow your data to focus on specific audiences or time windows. The following filters are available on the experiment analytics page:
Set a start and end date to focus on a specific period. Useful for isolating the impact of a promotion or seasonal change.
Filter by one or more countries to see how a variant performs in specific markets.
Choose between **Desktop**, **Mobile**, or **All** to compare behavior across device types.
Filter by **New visitors** (visitors whose first recorded visit happened after the experiment started) or **Returning visitors** (visitors who had already visited before the experiment started) to understand how each segment responds to your test.
Visitor type is not determined by Shopify's session cookie. ABConvert determines visitor type using each visitor's first-seen timestamp and the experiment start time:
If the first-seen timestamp is after the experiment start time, the visitor is counted as new.
If the first-seen timestamp is before the experiment start time, the visitor is counted as returning.
To segment this data correctly, enable the visitor label script in your theme settings before the experiment starts and keep it enabled. Visitors tracked only after the script is enabled may otherwise be treated as new by default.
## How quickly does analytics update?
Analytics data is typically refreshed within about 1 hour.
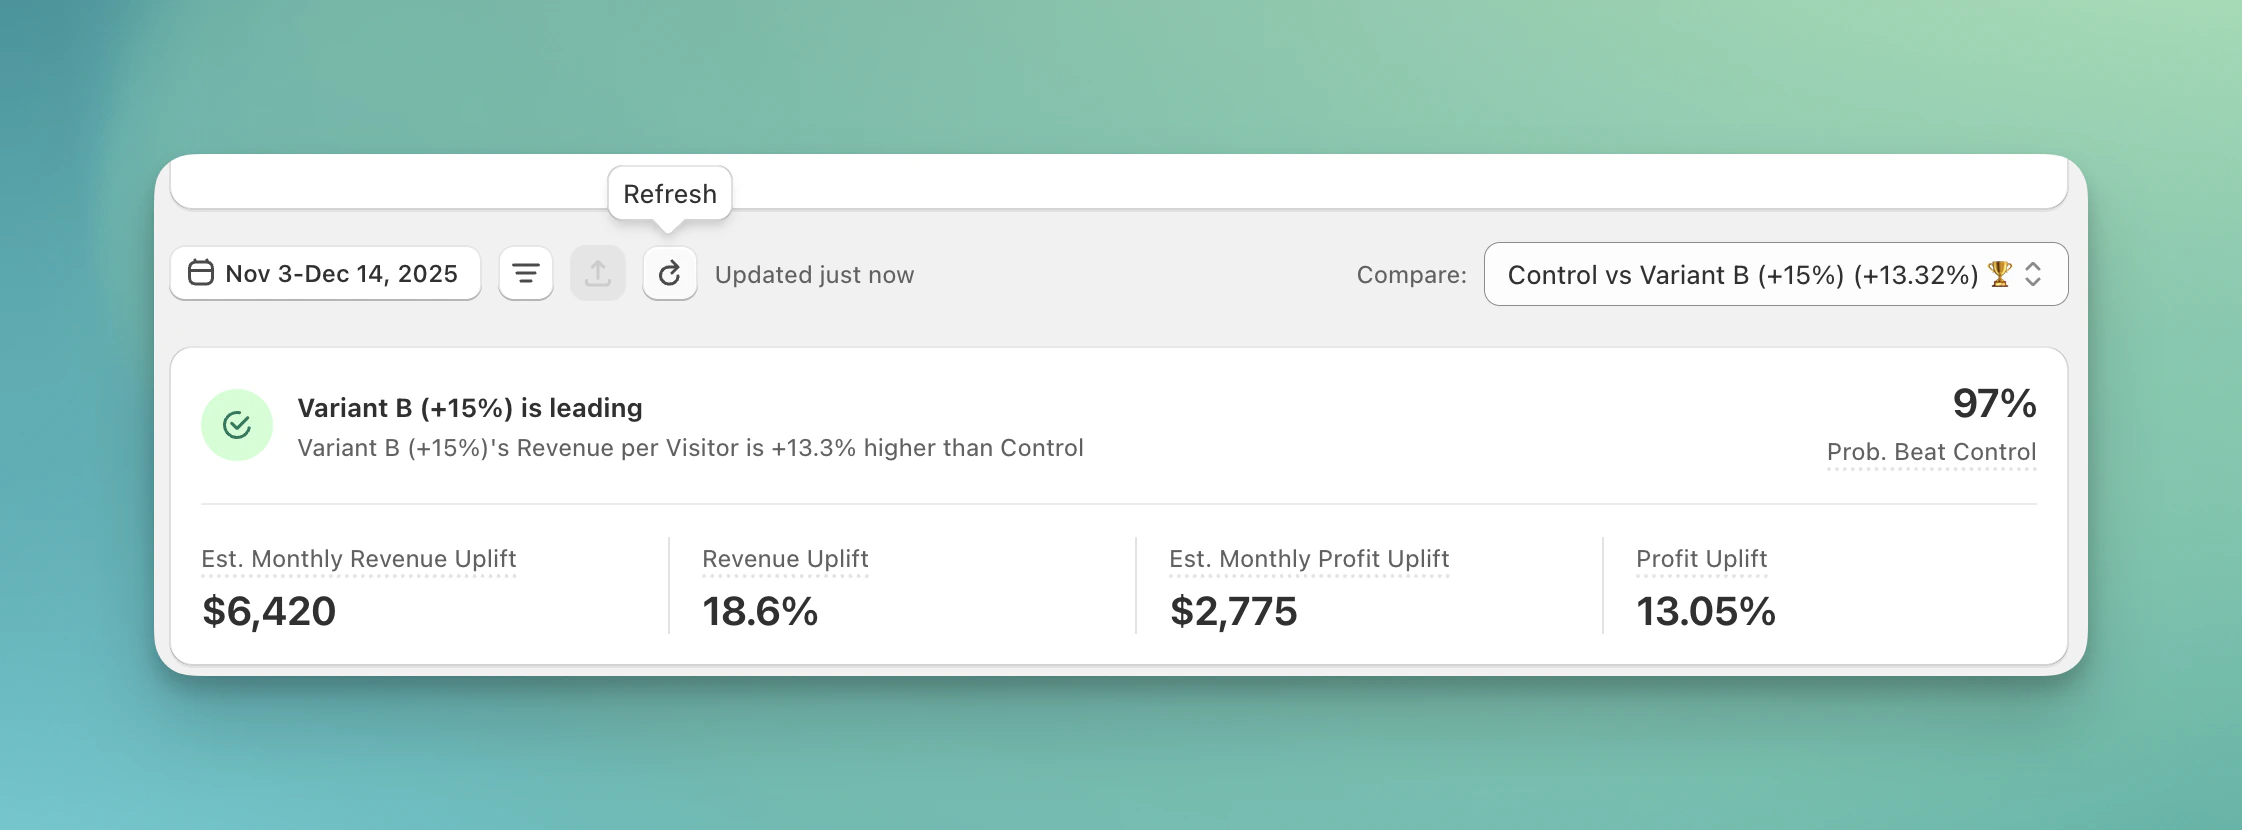
If you want to confirm whether new data is available, click the **Refresh** button in the analytics page.
## Filtering your results
You can narrow your data to focus on specific audiences or time windows. The following filters are available on the experiment analytics page:
Set a start and end date to focus on a specific period. Useful for isolating the impact of a promotion or seasonal change.
Filter by one or more countries to see how a variant performs in specific markets.
Choose between **Desktop**, **Mobile**, or **All** to compare behavior across device types.
Filter by **New visitors** (visitors whose first recorded visit happened after the experiment started) or **Returning visitors** (visitors who had already visited before the experiment started) to understand how each segment responds to your test.
Visitor type is not determined by Shopify's session cookie. ABConvert determines visitor type using each visitor's first-seen timestamp and the experiment start time:
If the first-seen timestamp is after the experiment start time, the visitor is counted as new.
If the first-seen timestamp is before the experiment start time, the visitor is counted as returning.
To segment this data correctly, enable the visitor label script in your theme settings before the experiment starts and keep it enabled. Visitors tracked only after the script is enabled may otherwise be treated as new by default.
## How quickly does analytics update?
Analytics data is typically refreshed within about 1 hour.
If you want to confirm whether new data is available, click the **Refresh** button in the analytics page.